The product and technology view of our latest launch
Authors: Shayak Sen, CTO, and Anupam Datta, President and Chief Scientist
We’re proud to announce the general availability of TruEra’s full-lifecycle AI observability platform. This release brings together all of the key modules of the TruEra platform on a hosted cloud offering. Data scientists, ML engineers and LLM app developers can now get started with using a few lines of code to use a single platform to test, debug and monitor their AI applications across all stages of the life cycle: from development to production.
Observability throughout the AI Lifecycle
AI Observability shouldn’t just be restricted to monitoring your models in production. It’s important to start evaluating your applications starting from early stages of experimentation to validation before deployment and then use the same criteria to monitor on an ongoing basis post deployment. At each point, it’s also critical to have tools to debug models and data so that you can quickly identify and triage issues. In the diagram below we show where the observability layer lives in your MLOps/LLMOps stack.
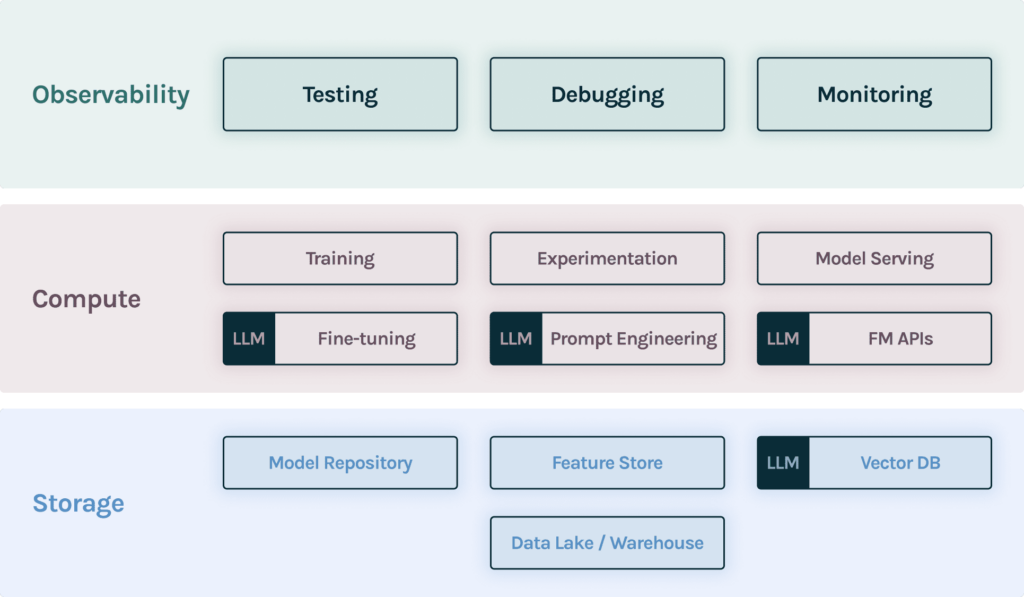
TruEra integrates easily with each layer of your observability stack so that you can rapidly test, debug and monitor your application from experimentation to production. This release brings together a number of key capabilities onto the hosted cloud platform that enables:
- Ease of use and integration: AI developers, data scientists, and MLOps practitioners need tools that integrate easily into their workflows.
- Scale: ML use cases are data intensive. We leverage the lambda architecture to meet the scale needs of millions of predictions per minute.
- Flexible root cause analysis: Debugging models requires zooming in from a birds eye view to individual predictions rapidly. Such root cause analysis places very different needs on the infrastructure.
- Evaluating LLMs: Large Language Models are harder to evaluate. This is primarily because of the lack of ground truth and evaluation metrics. We introduce the ability to track a number of different kinds of metrics through the general abstraction of “feedback functions”.
- Enterprise readiness: Working with Fortune 100 enterprises requires the next level of security, data governance, disaster recovery, access control policies to be built in.
Let’s dive deeper into each of these topics.
Get started with just a few lines of code and flexible integrations
Model training, experimentation and serving can be very different in different teams. To allow for easy integration with a wide range of workflows, we’ve created simple abstractions to connect TruEra to your data.
For example, one common mode of ingesting model data into TruEra is through the add_data interface that pushes a batch of data as shown in this code snippet. This kind of an approach allows a developer to push any kind of data they have about their model (features, predictions, feature influences, transformations) together or separately as they become available.
tru.add_data(
    pd,
    column_spec=ColumnSpec(
        id_col_name="id",
        pre_data_col_names=pre_data_names,
        timestamp_col_name="prediction_time",
        label_col_names=["label"]),
)
A different ingestion mode involves periodically pulling from a predefined log. For example, in this SageMaker integration, we periodically pull data from an S3 bucket that has data being logged to it using SageMaker’s data capture functionality. Even though such an integration can be set up with a few lines of code, this automates the ingestion of data while not touching production serving pipelines at all.
from truera.client.integrations.sagemaker import setup_monitoring

column_spec = ColumnSpec(
    id_col_name=None,
    pre_data_col_names=column_names
)

workflow_id = setup_monitoring(
    tru,
    split_name=split_name,
    datacapture_uri=S3_DATACAPTURE_URI,
    credential_name=credential_name,
    column_spec=column_spec
)
Monitor at massive scale
ML use cases can generate massive amounts of data. With TruEra, you can monitor millions of predictions per minute across hundreds of models to generate dashboards that give you an aggregate view of how well your models are doing. while still being able to slice and dice to specific segments and time ranges efficiently.
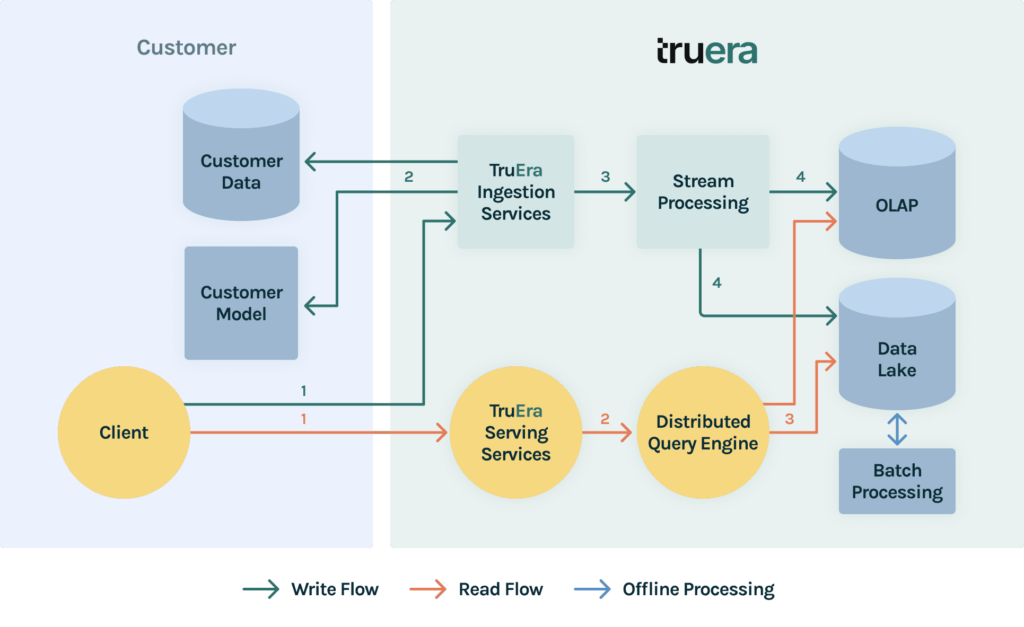
Monitoring at the millions of events per minute requires scaling ingestion, storage and compute. We enable this level of scale by using a lambda architecture to process data through the system. As shown in the diagram above this involves creating a batch layer and a speed layer. Data is ingested at the same time to both layers. The batch layer is responsible for maintaining a canonical view of the data so that data can be backfilled and corrected over time. The speed layer is responsible for handling high velocity recent data to provide low latency insights to recent events.
This architecture allows us to ingest batch and streaming data at massive scale. Critically, this also allows join predictions and labels for models with delayed labels and update historical views on an ongoing basis.
The storage is optimized to enable rapid computation of metrics over flexible time slices through an OLAP store. This means that data at varying levels of granularity such as day over day to month over month can be queried at low latency. In addition, a data lake allows saving raw data to enable troubleshooting on demand. Our tiered storage architecture categorizes data based on its business value and different service level agreement needs
Finally, the compute components are optimized to calculate performance, drift, fairness metrics across segments. The compute services auto-scale horizontally and vertically as ingestion and compute workloads grow.
This article covers the scalable architecture in greater detail.
Zoom in from a birds-eye to a single record in seconds with integrated diagnostics
Root cause analysis for debugging issues with model performance often requires finding needles in a haystack. With the new diagnostics and monitoring integration, TruEra lets you switch between a macro-view of your data to a micro-view within a few seconds to enable responsive debugging. In this example, you’ll see us go from a global view of your performance, to understanding performance on a single time slice, to the behavior of a single feature (leveraging a unique form of Distributional Shapley Value-based root cause analysis) and then down to a single record.
This is one example of how AI developers can go from identifying issues with model performance to understanding what might be causing that. This online ML testing and debugging course provides an overview of key debugging and diagnostics capabilities for ML models and hands-on exercises with TruEra’s free product.
Evaluate LLMs from Training to Production
Initial development of LLM-based applications is dramatically increasing since the launch of ChatGPT. However, LLM-based applications have well-known risks for hallucinations, toxicity and bias. We now offer new capabilities for testing and tracking LLM apps in development and in live use, so that risks are minimized while accelerating LLM app development. These capabilities are most useful in conjunction with TruLens – TruEra’s open source library for evaluating LLM applications that allows the definition and computation of a wide range of metrics that measure LLM quality through feedback functions.
TruLens fits easily into the emerging LLMOps tech stack. It offers easy integrations and complements popular frameworks for building LLM applications, including LlamaIndex, LangChain, and vector databases like Pinecone. It’s also easy to work with a broad set of LLMs with TruLens.
Below we show how TruLens can help measure groundedness: one of the key components of identifying hallucinations in LLM responses. This also provides a reason for low groundedness: the LLM provided a response that could not be traced back to the context provided to the LLM for tasks, such as summarization and retrieval-augmented generation.
Hosted and Enterprise-Ready
All of the powerful functionality we described above is now available as a TruEra hosted cloud platform. This now provides the widest range of options for enterprise customers to deploy TruEra. Customers can deploy within their VPC, on TruEra cloud or an isolated cloud instance providing a wide range of deployment and management options. TruEra offers with flexible authorization that enables collaboration and sharing securely with a wide range of stakeholders, while offering encryption-at-rest and in-motion.
Get Started Today
In total, this release represents a massive step forward for AI practitioners and provides them with the right tools to build powerful applications that are aligned with human and business expectations. Full-lifecycle observability allows organizations to test, debug and monitor the quality of their models from development to production and back.
Try it out for free today: TruEra AI Observability for model testing and evaluation.
Shout out to some awesome individuals
We want to acknowledge the contributions of the outstanding TruEra team that brought this product to life, spanning research, engineering, and product. Our team has significant strengths in research, starting from our own work at Carnegie Mellon University on key elements of explainability, testing, and debugging of ML models. The recent release builds on those results and augments them with innovations, such as feedback functions, to evaluate and monitor LLM applications. Our engineering and product team brings decades of experience in building scalable data and ML platforms at places like Google, Visa, Microsoft, and hyperscale startups; they innovated to create and implement a scalable architecture that simultaneously monitors models and apps while allowing deeper root cause analysis for debugging. And perhaps most importantly, the product vision and execution was closely informed by deep understanding of the needs of our users, through engagement with our customers and development partners, structured user interviews, and significant practitioner experience on the team in data science, MLOps and specific verticals, including financial services, retail, security, and technology.