This blog describes the data platform components required for ML Monitoring and Model Debugging at scale. First, I will compare and contrast the use cases and query patterns of ML Monitoring and Model Debugging systems. Next, I will discuss the components required to meet these query patterns for both systems. Lastly, I will briefly describe the performance capabilities of our data platform and show that it is built for scale.
ML Monitoring vs. Model Debugging
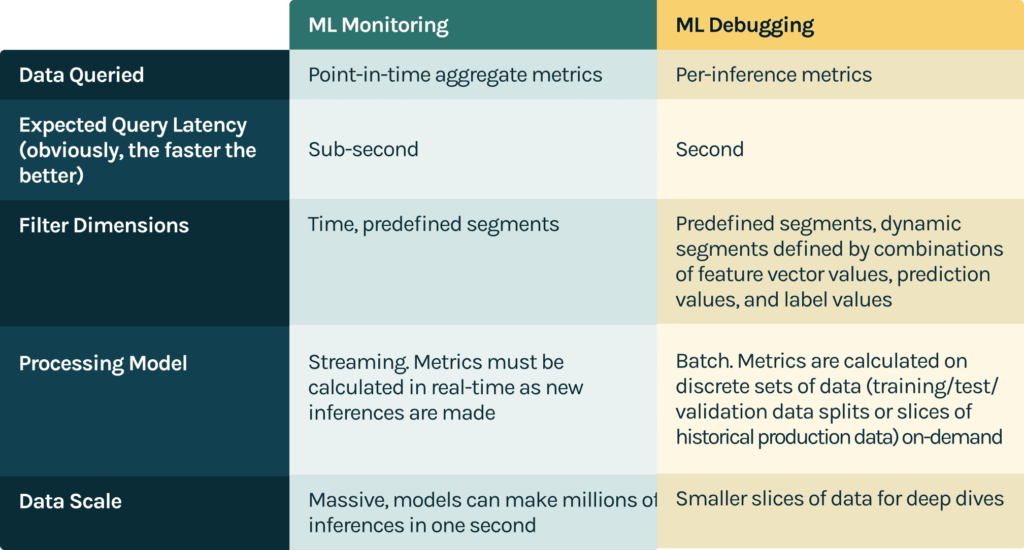
The purpose of model monitoring is to track several model (e.g. performance, fairness, stability, prediction distributions) and data metrics (e.g. feature distributions, data quality) over time and compare these metrics against baselines to identify issues in a model as soon as they occur.
The purpose of model debugging is to root cause model quality issues before or after the model is deployed. A model debugging platform helps uncover insights by computing per-inference feature importance and performance metrics and allowing ML practitioners to slice and dice them on key dimensions.
Data Platform Components
The data platform components required for ML monitoring and model debugging can be split into roughly three buckets:
- Ingestion
- Storage
- Compute
Ingestion
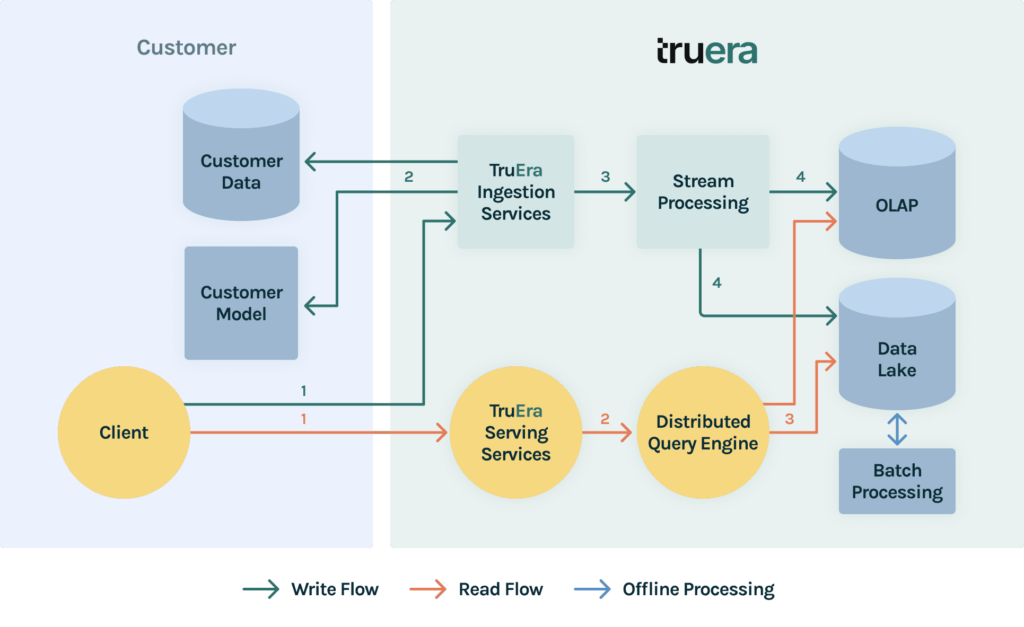
TruEra users ingest inference data for pre-production models or production batch inference models using our batch APIs. Users ingest inference data for online production models using our point-by-point or micro-batch APIs. Although the ingestion APIs vary for streaming ingestion and batch ingestion, TruEra uses a unified ingestion pipeline under the hood to maintain a single codepath to reduce the surface area of bugs.
Storage
Once data is ingested into the TruEra platform, it is stored in different systems each optimized to serve the different monitoring and model debugging query patterns described in the previous section.
Online Analytical Processing (OLAP) data stores are a good fit for storing monitoring data as they allow for low latency rollup and slice/dice queries across dimensions like time. Modern OLAP stores also have tight integrations with modern distributed event storage and streaming platforms to enable real-time updates of OLAP cubes.
The main drawback of using an OLAP store alone for data storage is that it is impossible to recover raw, unaggregated data from aggregated data cubes. This is problematic for two reasons:
- We need row-level raw data to unlock model debugging functionality. We could theoretically store “in-rolled-up” data in our OLAP store, but this prevents our system from having sub-second queries.
- We want to store row-level raw data for data backup purposes. In case we introduce bugs in our pipelines that write to our OLAP store, we’d like the ability to simply re-ingest data into our aggregated store without customer intervention.
To address these challenges, we introduced a data lake to our stack. The data lake stores raw unaggregated inference data to provide the foundation for interactive analysis for our model debugging system.
Compute
TruEra uses battle-tested open source stream processing technology to validate and process ingested data before it lands in our storage systems. TruEra uses Apache Spark to process data stored in our data lake offline to optimize it for model debugging queries. To serve metrics for interactive model debugging queries, TruEra computes metrics at query time using a distributed query engine. We use clever data lake partitioning and caching to reduce the latency of query time calculations.
To calculate performance metrics and alert on them for ML monitoring, TruEra joins ground-truth labels with their corresponding predictions. This is challenging to do efficiently because model feedback loop durations (i.e. delta between prediction time and ground truth label acquisition) vary depending on the domain of the ML model. Some model feedback loop durations (i.e. delta between prediction time and ground truth label acquisition) may be as short as milliseconds and others may be as long as months. This means that users may ingest labels immediately after ingesting inferences or wait months until the ground truth for the inference is known.
Many monitoring metrics on production data are technically infeasible to exactly calculate, because they require scanning all points. To address this, we use data sketches to efficiently aggregate and approximate key metrics.
Scale
In the previous section, we discussed the motivation behind the high-level components of TruEra’s data platform. In practice, though, what does the platform support? Our data stack supports:
- Auto-scaling horizontally and vertically as ingestion and compute workloads grow
- Ingesting Xm inferences/second via streaming ingestion APIs
- Ingesting Xxb rows/day via batch ingestion APIs
- Sub-second monitoring slice and dice operations across time periods with fine time granularity (order of minutes)
- Calculation of performance metrics within seconds of labels ingested in certain cases
- Joining of predictions and labels for models that have feedback loop durations on the order of months
If you are interested in trying TruEra for pre-production model debugging, click here to get free access to TruEra Diagnostics!