
As machine learning explainability takes center-stage in ensuring the trustworthiness and quality of ML models, getting it right is becoming critical.
Until recently, explainability was largely seen as an important, but narrowly-scoped requirement towards the end of the model development process. However, this is changing rapidly (see “Machine Learning Explainability is Just the Beginning” for more on this). Explainability is increasingly regarded as a multi-layered requirement that provides value throughout the ML lifecycle. In addition to providing fundamental transparency into how ML models make decisions, explainability also enables broader assessments of ML model quality, such as those around robustness, fairness, conceptual soundness, and stability.
Given the increased importance of explainability, organizations hoping to adopt ML at scale must pay greater attention to the quality of their explainability approaches and solutions. This is particularly true for organizations with high-stakes or regulated use cases. There are many open-source options available to address narrow aspects of the explainability problem, and we detailed the elements of good explainability frameworks in a previous post (see “Machine Learning Models Require the Right Explanation Framework”). However, it is hard to stitch these options together into a coherent, enterprise-grade solution that is robust, internally consistent and high performing across model types and development platforms.
We believe that to be “fit for purpose” an explainability approach must meet four key tests:
- Does it explain the outcomes that matter?
- Is it internally consistent?
- Is it able to perform at the speed and scale required?
- Can it satisfy rapidly evolving expectations?
1. Does it explain the outcomes that matter?
As machine learning models are increasingly used to influence or determine outcomes of high importance in people’s lives, such as in deciding a loan, a successful job application, or a school admission, it is essential that explainability approaches provide reliable, trustworthy explanations as to how models arrive at their decisions.
Explaining a classification decision (a yes/no decision) is often vastly divergent from explaining a probability result or model risk score. “Why did Jane get denied a loan?” is a fundamentally different question from “Why did Jane receive a risk score of 0.63?”
While conditional methods like TreeSHAP are accurate for model scores, they can be extremely inaccurate for classification outcomes. As a result, while they can be handy for basic model debugging, they are unable to explain the “human-understandable” consequences of the model score, such as classification decisions.
Instead of TreeSHAP, consider Quantitative Input Influence (QII). QII simulates breaking the correlations between model features in order to measure changes to the model outputs. This technique is more accurate for a broader range of results, including not only model scores but also the more impactful probabilities and classification outcomes.
To truly understand and trust a model, reliable outcome-driven explanations are essential. In regulated industries, it can be detrimental to provide explanations for model score when one is actually seeking an explanation for a final model outcome. For example, if a customer is denied a loan, they will expect an explanation for that decision, not for the internal score attributed to them by the model. The factors that determine the ‘yes/no’ decision may be different from those that determine the numeric model score.
Outcome-driven explanations are also very important for questions surrounding unjust bias. For example, if a model is truly unbiased, the answer to the question “Why was Jane denied a loan compared to all approved women?” should not differ from “Why was Jane denied a loan compared to all approved men?”
2. Is it internally consistent?
Individual open-source offerings are often restricted in scope. Many build directly on top of SHAP and are thus automatically limited to model scores and probabilities. In search of a broader solution, some organizations have cobbled together an amalgam of narrow open-source techniques. However, this approach can lead to different tools for different types of models or different stages of the model lifecycle. It can also provide contradictory results for the same model, depending on whether a local or global explanation is being sought.
A coherent explainability approach must ensure consistency along three dimensions:
(A) explanation scope (local vs. global);
(B) the underlying model type (traditional models vs. neural networks); and
(C) the stage of the ML lifecycle (development, validation, and ongoing monitoring).
(A) Consistency: Explanation Scope
Deep model evaluation and debugging capabilities are critical to deploying trustworthy ML. In order to perform root cause analysis, it’s important to be grounded in a consistent, well-founded explanation foundation. If different techniques are used to generate local and global explanations, it becomes impossible to trace unexpected explanation behavior back to the root cause of the problem, and therefore removes the opportunity to fix it.
As an example, consider a model that predicts whether an individual is at risk of defaulting on a loan. We can first examine the overall drivers of model decisions by looking at features with high global importance using the QII framework.
Figure 1: Feature importances for loan default risk prediction
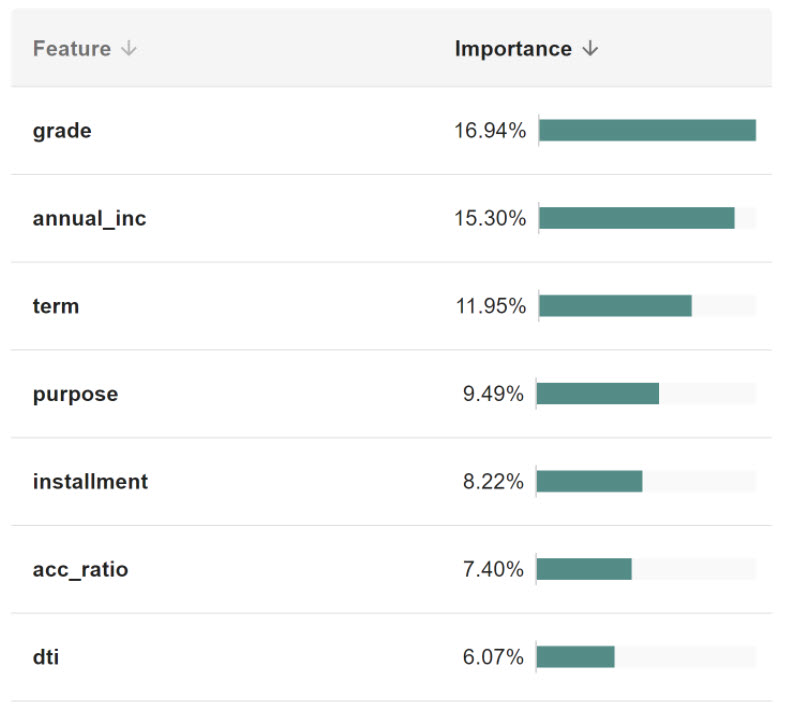
The prediction of loan risk default is driven by a variety of features. Here we display the top seven most important features, from loan grade to debt-to-income ratio (dti).
We will focus more closely on the debt-to-income feature (dti), as upon further inspection, it exhibits strange behavior. Since the global explanations are aggregated directly from Shapley values for individual points, we can easily visualize the influence sensitivity of debt-to-income. The influence sensitivity plot for dti (Figure 2, following) measures how the influence of the feature on the final model outcome (y axis) changes as a function of the feature value (x axis).
Figure 2: The impact of debt-to-income value on loan default risk prediction
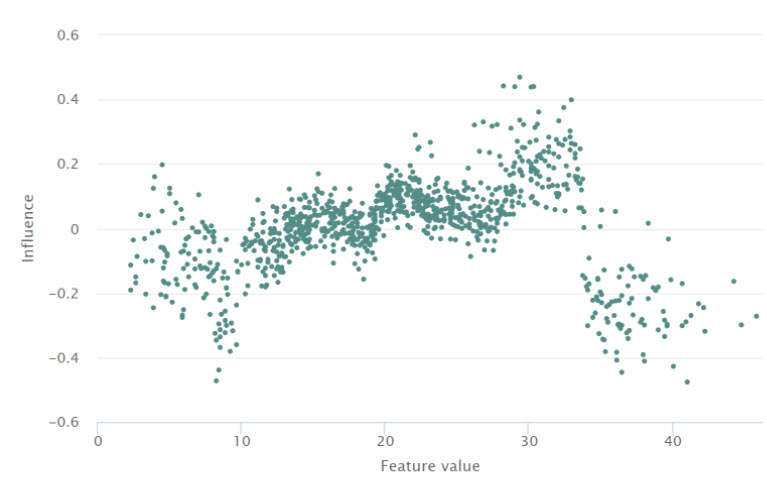
As the debt-to-income ratio increases, the contribution of the feature value to an individual’s credit risk increases, matching human intuition. However, for extremely high debt-to-income ratios, the model strangely finds that its contribution to risk decreases.
As dti increases (x axis), it has greater influence on the default forecast. However, very high dti values are behaving unexpectedly in this model and are worthy of investigation.
This is similar in flavor to a partial dependence (PDP) or accumulated local effects (ALE) plot, but because influence sensitivity plots rely on local explanations that are calculated at a per-point level, strange behavior can be directly attributed down to specific input points. These points can then be investigated further to get to the root cause of the problem.
In the example above, high dti values appear to have negative influence, indicating that they reduce the model’s prediction of a person defaulting on their loan. This is an unusual result, since one would think that a greater amount of debt to a person’s income would increase the likelihood of default, as seen with the other values. This abnormality can be easily investigated; QII makes it traceable back to a specific set of points that are likely causing this erroneous behavior, and in fact, many of points with high debt-to-income ratio were mislabelled in the training data. In this way, the consistency between local and global explanations enables end-to-end model debugging, which is much harder to directly trace back to the underlying data or model when global importances are not derived from local ones.
(B) Consistency: Model Type
A good explanation framework should ideally be able to work across ML model types – not just for decision trees/forests, logistic regression models and gradient-boosted trees, but also for neural networks (RNNs, CNNs, transformers). For example, TruEra’s neural network capabilities, although not covered extensively here, draw on research that computes Shapley values for differentiable outputs via integrated gradients. We also generalize this work to provide developers with internal explanations that can capture inner workings of a layer within a neural network. These methods satisfy the same axiomatic foundations of explanations as QII. Using the same axiomatically-derived and Shapley value-based explanations for gradient-based models creates consistent explanations that can be compared across model types.
(C) Consistency throughout the machine learning lifecycle
Explanations need not be consigned to the last step of the ML lifecycle. They can act as the backbone of ML model quality checks in development and validation, and then also be used to continuously monitor models in production settings. Seeing how model explanations shift over time, for example, can act as an indication of whether the model is operating on new and potentially out-of-distribution samples. This makes it essential to have an explanation toolkit that can be consistently applied throughout the ML lifecycle.
3. Is it able to reliably perform at scale?
Performance at scale
Explanations, and particularly those that estimate Shapley values like SHAP and QII, are always going to be approximations. All explanations (barring replicating the model itself) will incur some loss in fidelity. All else being equal, faster explanation calculations can enable more rapid development and deployment of a model.
The QII framework can provably (and practically) deliver accurate explanations while still adhering to the our principles of a good explanation framework. We compared TruEra’s explainability technology, which is an in-house implementation of the QII framework in practical real-world settings , and we found it to be significantly faster than TreeSHAP and KernelSHAP, while also being more accurate compared to exhaustively computed Shapley values.
Further, scaling TreeSHAP and KernelSHAP computations across different forms of hardware and model frameworks requires significant infrastructure support. TruEra’s solution, with its lighter computational burden and faster speed, means that less infrastructure is required, reducing both capital and operational costs.
Reliability in implementation
Even when computing explanations via Shapley values, it can be a significant challenge to correctly and scalably implement these explanations for real-world use cases. Common implementation issues include problems with how correlated features are dealt with, how missing values are treated, and how the comparison group is selected. Subtle errors along these dimensions can lead to significantly different local or global explanations, and the devil can be in the details: careful consideration of implementation edge cases is important to get right to meet industry requirements.
4. Can it meet rapidly evolving requirements?
The question of what constitutes a good explanation is evolving rapidly. On the one hand, the science of explaining ML models, and of conducting reliable assessments on model quality (such as bias, stability and conceptual soundness) is still developing. On the other hand, regulators around the world are framing their expectations on the minimum standards for explainability and model quality. As ML models start getting rolled out in new industries and use cases, expectations around explanations will also change.
Given this shifting baseline of requirements, it is essential that the explainability toolkit used by a firm remains dynamic. Having a dedicated R&D capability – to understand evolving needs and tailor/enhance the toolkit to meet them – is critical.
***
Explainability of ML models is central to building trust in ML models and ensuring large-scale adoption. Using a medley of diverse open-source options to achieve that can appear attractive, but stitching them together into a coherent, consistent, and fit-for-purpose framework remains challenging. Firms looking to adopt ML at scale should spend the time and effort needed to find the right option for their needs.
Authors
Shayak Sen, Co-Founder and CTO
Anupam Datta, Co-Founder, President, and Chief Scientist
Divya Gopinath, Research Engineer
A version of this blog post first appeared in InfoWorld as “4 Key Tests for your AI Explainability Toolkit.”
This blog post is the third in a series. For the first two blog posts, see:
1.Machine Learning Models Require the Right Explanation Framework