Getting Started
with TruEra on New Relic
Leverage TruEra's best in class AI Quality diagnostics and monitoring with New Relic
With this integration, TruEra and New Relic users can go beyond standard accuracy, input and output drift monitoring by identifying consequential data drift, and other AI Quality diagnostics such as fairness, conceptual soundness and segment behavior. When combined with New Relic’s comprehensive observability capabilities, MLOps teams can correlate signals throughout the ML lifecycle.
Adding a model to TruEra
TruEra provides command line interface(CLI) and Python client to ingest an ML model and data. Steps to add a model using the CLI are outlined below.
Step 1
Create a new project.
> tru add project –project_name demo_project
Step 2
Create a data collection: data collection is a logical entity that holds data.
> tru add data-collection \
–project_name demo_project \
–data_collection_name demo_data_collection
Step 3
Add training or base data split: This data would be used as baseline to determine if any of the concepts drift.
> tru add split \
–project_name demo_project \
–data_collection_name demo_data_collection \
–split_name train \
–split_type train \
–pre_transform_path data_raw.csv \
–post_transform_path data_num.csv \
–labels_path label.csv \
–extra_data_path extra_data.csv
Step 4
Package and ingest the model:
> tru package python-model –model_path model.pkl \
–dependencies scikit-learn=0.21.2 \
–pip_dependencies cloudpickle==1.2.1,xgboost==0.90 \
–output_dir xgboost_demo –framework_wrapper xgboost
> tru add model –project_name demo_project –data_collection_name demo_data_collection –model_name xgboost_demo –model_type PyFunc –path_to_model xgboost_demo
Step 5
Periodically add production data to TruEra for monitoring. TruEra will process the new data and compute aggregate metrics.
> tru add split \
–project_name demo_project \
–data_collection_name demo_data_collection \
–split_name oot \
–split_type oot \
–pre_transform_path data_oot101_raw.csv \
–post_transform_path data_oot101_num.csv \
–labels_path label_oot101.csv \
–extra_data_path extra_data_oot101.csv
–begin “2020-01-01T10:00:00.021-05:00”
–end “2020-01-01T11:00:-0.021-05:00”
Stream data from TruEra Monitoring to New Relic
Whenever a new set of data is ingested into TruEra Monitoring, it computes relevant metrics and stores them. These computed metrics can be periodically pushed to New Relic using truera2newrelic data exporter. This exporter needs API keys generated by the TruEra console and the New Relic console.
Step 1
Install truera2newrelic cli. You will get the version number from the /downloads page.
pip install /packages/python_wheel/truera_newrelic–py3-none-any.whl
E.g:
pip install http://truera.mycompany.com/packages/python_wheel/truera_newrelic-4.0.0-py3-none-any.whl
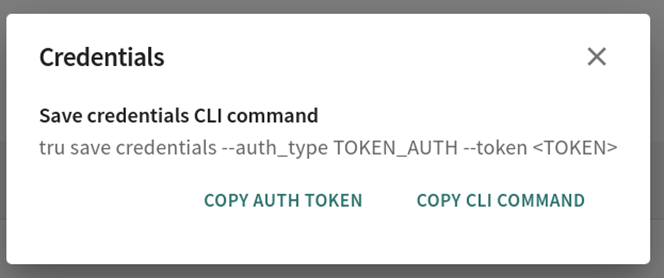
Step 2
Go to the TruEra console to generate the API key:
Goto /users page and click on “Generate Credentials”
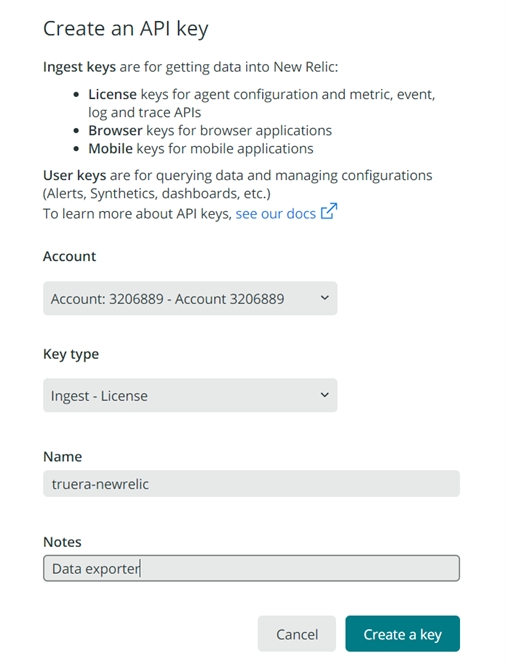
Step 3
Go to the New Relic console to generate the API key
- Go to the API key page in the New Relic console and create two keys:
- User Key – for dashboard management
- Ingest License Key – for metrics ingestion
Step 4
Verify the first data export run.
- Run the following command in terminal to verify that the data export works as expected.
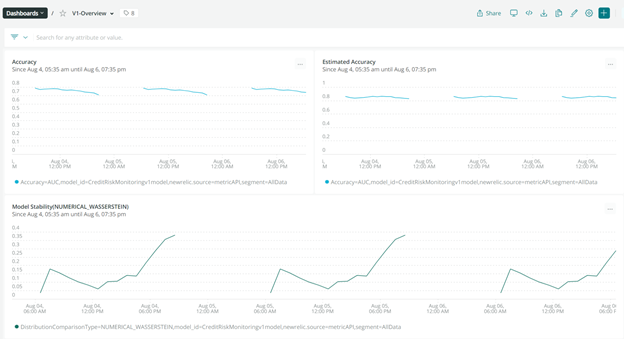
- Go to the dashboard section of one.newrelic.com. You will see a dashboard setup for the given ML model. Verify that the recently exported model metrics are visible.
> truera2newrelic metrics
–trueraurl http://truera.mycompany.com/
–trueraapikey <>
–newrelicingestapikey <>
–projectname demo_project
–modelname xgboost_demo
–lastsynctimestamp <>
Step 5
Set up the batch data exporter on a VM. You can use any VM on the same virtual private cloud as the machine where the TruEra instance is running. It’s preferred to run it on the same machine as the TruEra instance.
- Setup cron which would periodically read data and export it to New Relic. The command used here would be the same as the one that you had used above for testing. Conda environment used here would be
# Sample command for hourly data export.
0 * * * * truera2newrelic metrics
# E.g: Sample command
0 * * * * /home/user/miniconda3/envs/env1/bin/python truera2newrelic metrics –trueraurl http://truera.mycompany.com/ –trueraapikey <> –newrelicapikey <> –projectname demo_project –modelname xgboost_demo –lastsynctimestamp <>
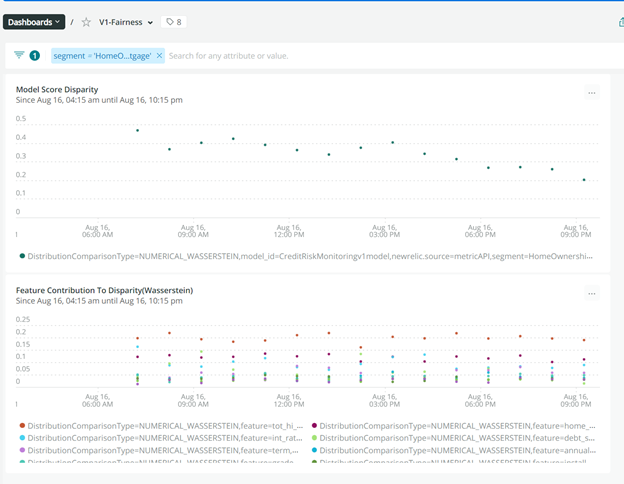
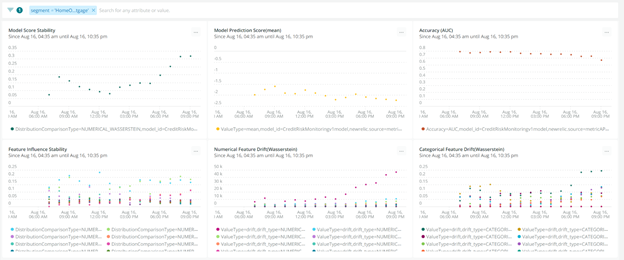
How to access the out-of-the-box dashboards
To visualize ML Monitoring metrics, TruEra provides skeleton dashboards to monitor and drill down on issues using themes like: model health, segment drilldown, feature values, data quality, fairness, etc. These dashboards can be set up using the truera2newrelic dashboard tool.
> truera2newrelic dashboard
–trueraurl http://myorg.com
–trueraapikey <>
— newrelicaccountid <>
–newrelicingestapikey <>
–projectname demo_project
–modelname xgboost_demo
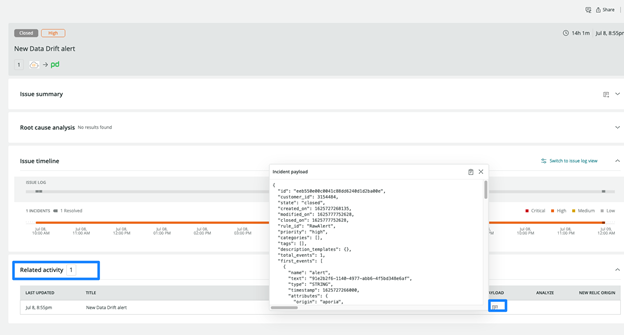
Set up alerts
New Relic allows clients to set up alerts when metrics deviate above threshold. To do so, follow these steps:
Step 1
Set up alerts notifications: Once you’ve created some dashboards, you can get alerted on your data. To create a NRQL alerts condition from a chart, click the chart menu , then click Create alert condition. Once you’ve named and customized your condition, you can add it to an existing policy or create a new one.
Step 2
Get notified: Once you’ve created an alerts condition, you can choose how you want to be notified. See our docs on how to set up notification channels.
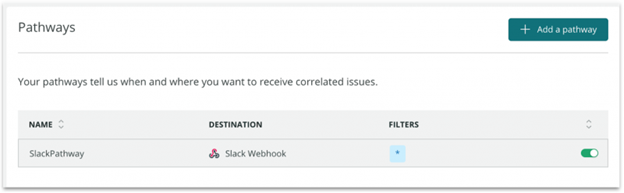
Step 3
Correlate your incidents: In addition to notifications, you can use Incident Intelligence to correlate your incidents. See our docs on how to correlate incidents using decisions.